 Most shop owners and managers understand that the Profit and Loss Statement (P&L) is a summary of performance over the past month, quarter or year. This financial report is known by several names. Yours may be called a Statement of Income and Expense. In a dealership, it may be referred to as the Operating Statement. Unfortunately, most of us don’t view this important financial report as a tool.
In the first installment of this series in the August 2015 issue of BodyShop Business, we looked at the proper format for the P&L and discussed the importance of P&L “calibration.” Just like any tool, the P&L must be properly calibrated to be used. The importance of working with your accountant or controller in the use of this tool was also stressed.
This month, we will look at the use of the P&L to generate Key Performance Indicators (KPIs). The generation and interpretation of KPIs can assist collision repair shop ownership and management by discovering problems or “opportunities for improvement.” KPIs can tell you where your shop is doing well, and where your shop may not be doing so well. Then, we’ll use the P&L as a tool to determine how much we need to sell to achieve a target profit.
Management Systems
You may already have a management system. Management systems are great tools! One of the most valuable functions of management systems is job costing. In effect, a management system can generate a P&L for each individual job! Management systems also generate a lot of KPIs.
Most shop owners and dealership managers are familiar with how the accountant or controller may have to offset differences between a management system report and an accounting report. The phrase most commonly used is “write-off.” That’s not a good word to hear when you think you’re getting a bonus, but to balance the accounts, “they had to write off” the amount of money that was to be the basis of that bonus.
If your management system and P&L reports don’t match, your system is badly in need of calibration. Fix it. You wouldn’t mix paint on a scale that needed to be calibrated!
KPIs
When used as a tool, P&L is most commonly used to generate KPIs. KPIs can tell you how your company is doing in comparison to the industry or segments of the industry.
Let’s take another look at the P&L we reviewed in the first installment of this series.
Gross Profit, stated as a percentage, is a common KPI. In the first installment of the P&L series, we learned that the formula to determine Gross Profit Percentage = (Sale-Cost)/Sale x 100. GP% may be calculated for the shop as a whole or any sales category (Profit Center). In the Sample Autobody P&L, the GP%s are calculated for each Profit Center as well as the overall GP.
Sample Autobody has an overall GP% of 35.3%, Labor GP% of 50%, Parts 20% and Paint/Materials a dismal 17.3%.
Taken alone, those numbers don’t mean much. We can begin to use the Sample P&L as a tool by comparing Sample’s GP%s to industry standards. This is referred to as “benchmarking.”
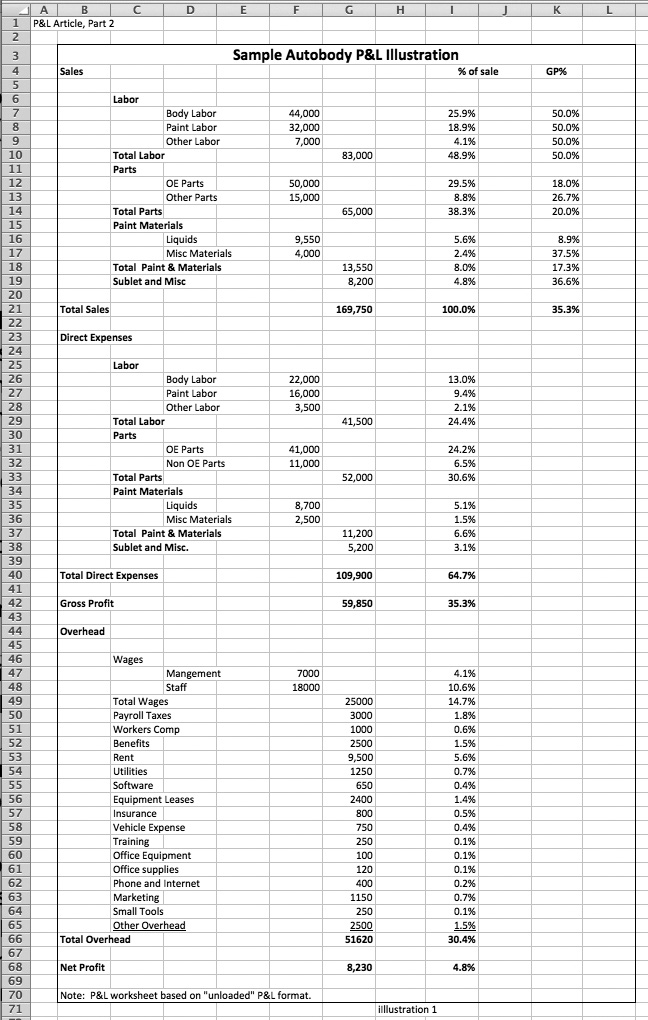
The industry standard GP% on labor (unloaded P&L format) is 65%. The industry standard for parts is 25% and 30% for paint/materials.
Benchmarking KPIs is a valuable use of the P&L. The use of benchmarking can help management locate problems or opportunities to improve performance. Sample Autobody needs to work on Gross Profit in labor, parts and paint. That’s a lot to work on! So Sample Autobody ownership needs to do some more digging.
Gross Profit Percentages are KPIs that are generated directly from the P&L. By combining additional relevant shop information, we can generate many more KPIs.
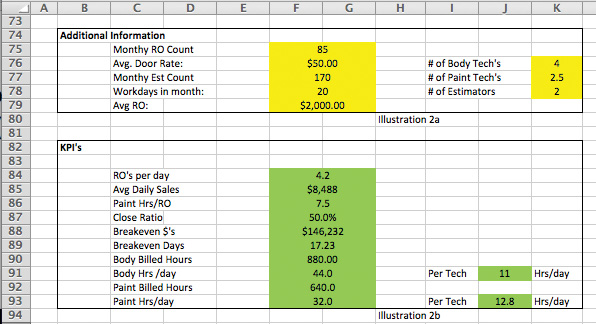
Let’s take a look at some additional information:
Combining the information in illustration 2a with the information contained in Sample Autobody’s P&L, we can generate many important KPIs. For this article, we’ll look at just a few.
Illustration 2b represents just some of the KPIs that may be generated with the P&L and just the information contained in illustration 2a.
Average RO: This simple and important KPI is calculated by dividing the Total Sales by the number of closed ROs for the same period. This KPI may be benchmarked. In addition to being used for benchmarking purposes, the average RO KPI is used in setting goals and targets.
Average Daily Sales: This KPI is used to level out the ups and downs of a typical collision center’s month. It is also used for planning purposes. This is calculated by dividing the Total Sales by the number of days worked during the same period.
Average RO: This important KPI is used for benchmarking and for planning purposes. This is calculated by dividing the Total Sales by the number of ROs for the same period of time.
Labor Efficiency: The math behind efficiency ratios is always the same: Hours sold/hours worked x 100. Efficiency ratios can be calculated for the entire shop, by department (as illustrated here), by team or by individual technician. Efficiency may be calculated for year, month, day or even individual RO.
Efficiency ratios are used for planning and personnel evaluations. Efficiency ratios are sometimes used for benchmarking. However, caution should be used when benchmarking efficiency ratios as these KPIs are very labor rate sensitive. Markets with higher labor rates generally have lower efficiency ratios than markets with lower labor rates. For this reason, we did not calculate Sample Autobody’s efficiency ratio. But you can!
Efficiency ratio caution: Many look at efficiency ratios as a measurement of technician speed. To a degree, that’s true. But remember the math to calculate efficiency ratios: Sold Hours/Worked Hours x 100. The technician generally has little or no control over sold hours! Estimators control sold hours! So the easiest way to improve efficiency is usually to improve estimating accuracy and increase sold hours!
Paint Hrs./RO: This KPI is used to evaluate estimating accuracy and benchmarking. It’s also used for planning purposes.
The calculation here is Paint Labor Sales/Door Rate = Paint Hours. Paint Hours/RO Count = Paint Hours/RO.
While this KPI is used for benchmarking, there’s frequently a difference between dealership collision centers and independents. Since the dealership is frequently performing small warranty and spot repairs, the dealership Paint Hrs/RO is generally lower than the independent.
Daily RO/Estimator: This simple KPI is calculated by dividing the RO/day by the number of estimators. It is used for planning purposes as well as to level out the ups and downs of the estimator’s month.
Close Ratio: This KPI measures how effective estimators are at converting estimates into repair orders. This is my personal favorite KPI as increasing close ratio results in an instant increase in sales!
Close Ratio = ROs/Estimates x 100
The Close Ratio generated by most management systems is frequently artificially high because many estimators do not import every estimate into the management system. To generate an accurate close ratio through a management system, all estimates must be uploaded into the management system.
There are many more KPIs that may be calculated utilizing the P&L and some additional information. If your shop has a management system, most of these KPIs are at your fingertips. Just make sure the numbers being generated by your management system match your P&L generated numbers through occasional spot checks.
Ideally, you should be comparing your shop’s performance to similar shops based on sales volume. Some KPIs, such as average RO and paint hours per RO, are available from the database providers. You may find access to good KPI benchmark information from your management system provider. Most paint companies have KPI information through their shop consultants and business development managers. Another way to obtain good information is to participate in an industry 20 Group.
Generating KPIs is just one way to use a P&L as a tool. Once you have a true understanding of the math behind the P&L, you can use it to look into the future, setting profit goals and knowing just what’s required to achieve those goals.
Breakeven Point
Each month, every business, including your collision center, is involved in a race against time to maximize sales by the end of the month. At the close of business on the last day of the month, you look at your sales for the month and decide if you won or lost the race. The next race starts when you open your doors on the first day of the next month.
Each day you deliver repaired vehicles, you also accumulate gross profit dollars. When those accumulated gross profit dollars equal the total overhead for the month, you’ve broken even.
Your business has not earned any profit, but that’s also the point at which you do not lose any money either.
To calculate your breakeven point, divide total overhead by your gross profit percentage.
Sample Autobody’s P&L shows Overhead of $51,620 and a GP% of 35.3%. Using the above math, dividing the Overhead of $51,620 by the GP% of 35.3% = a Breakeven Point of $146,232.30.Sample Autobody must sell that $146,232 to pay overhead with GP dollars. You can think of it like this: Your business makes no net profit until the business hits breakeven!
Once your business breaks even, all of your GP dollars fall straight to net profit! That’s why breakeven is so important! To maximize profitability, you want to reach breakeven as quickly as possible so you can maximize those profitable “post breakeven” sales!
Breakeven Point in Days
Breakeven can also be stated in days. How many days does it take to reach that breakeven point? Divide the breakeven sales figure by your average daily sales to determine breakeven point in days.
Sample Autobody has breakeven sales of $146,232 and average daily sales of $8,488. To calculate Breakeven Sales in Days, divide $146,232 by $8,488 = 17.23 days. Sample Autobody does not break even until about 10 a.m. on the 18th day of the month! That means the business is only generating profit for the ownership for 2 ¾ days in an average 20-day month.
Breakeven Sales in Days illustrates why some months are so bad. November and February frequently have only 17 or 18 work days. If it takes 18.23 days to break even and the month only has 17 work days, the shop will not break even for the month and there will be no net profit!
Profit Sales
Profit Sales represents the required sales to achieve a target net profit. Rather than just selling what you can and fixing what you can with the hope of a profit at the end of the month, profit sales and the resulting changes to the P&L will tell you exactly how much you need to sell to achieve a target Net Profit. Profit Sales will generate sales goals for the estimators and production targets for the production manager. Profit Sales and the P&L can be used to generate daily production goals for individual technicians!
Using Profit Sales to generate this information takes two steps. First, we need to calculate the Profit Sales KPI. Second, we need to use the profit sales number as the Net Profit in a forecast, or “pro-forma” P&L, then build a new P&L to determine what impact that has on profit centers and expenses.
The Profit Sales calculation is very similar to breakeven:
Profit Sales = (Overhead + Target Net Profit) / GP%
Determine a Net Profit Goal
Sample Autobody has a current Net Profit of $8,230 per month on sales of $169,750. That’s not real exciting! Most consultants suggest a minimum Net Profit target of 10% of sales. In this case, that would be $16,750, double the current Net Profit. In time, hitting that 10% net is doable, but for a first step, doubling the net would be over-aggressive. Let’s set an initial target Net Profit of $12,000 per month.
Goal setting should follow the SMART rule, meaning goals should be Specific, Measurable, Achievable, Realistic and Timely. The $12,000 per month Net Profit is realistic and achievable.
Let’s calculate Profit Sales for Sample Autobody. Sample Autobody has overhead of $51,620, GP% of 35.3% and a Net Profit Goal of $12,000 per month.
($51,620 + $12,000) / 35.3% = $180,226
Sample Autobody has a sales goal! The Profit Sales formula tells Bill that Sample Autobody can generate a net profit of $12,000 per month by increasing sales from $169,750 to $180,443.
The estimators now have a sales goal. They need to sell $180,443 per month. In a 20-day month, that’s a little more than $9,000 per day, roughly $500 per day more than they’re doing now. They can achieve the goal by increasing the number of ROs sold or by increasing the average RO, or a combination of the two.
Production now has a production goal! The shop must produce $180,443 over the next month.
That’s the first step – setting the goal. Now, let’s look at the impact of using the profit sales goals to generate a forecast P&L. Some refer to this as generating a “Pro-Forma” P&L. We’ll use the P&L as a tool to look into the future!
The Pro-Forma P&L is an illustration of what Sample Autobody’s P&L will show if increased sales are used to achieve the Net Profit Goal of $12,000 per month. Compare the Pro Forma P&L to the initial P&L to see the differences. Small changes add up to a significant impact to the bottom line!
Most will need the help of an accountant or controller to generate an accurate Pro Forma P&L. In effect, the Pro Forma is created by building the P&L backwards, beginning with the net profit target, adding overhead to arrive at a target Gross Profit and Gross Sales. Sales mix is used to arrive at departmental sales, and expenses are determined through the application of GP%.
Two important items are generated by the creation of the Pro-Forma P&L. First, goals are generated. As noted above, sales and production goals are developed through using the Profit Sales formula to generate the Pro-Forma P&L. Budgets are also created.
Example: Sample Autobody is currently selling $44,000 in body labor. At an average door rate of $50 per hour, that equals 880 hours. Looking at the Pro-Forma P&L, the new Body Labor Sales, to achieve the $12,000 Net Profit Goal, is $46,772 or 925 hours. The production manager knows he must now generate 925 hours of body labor.
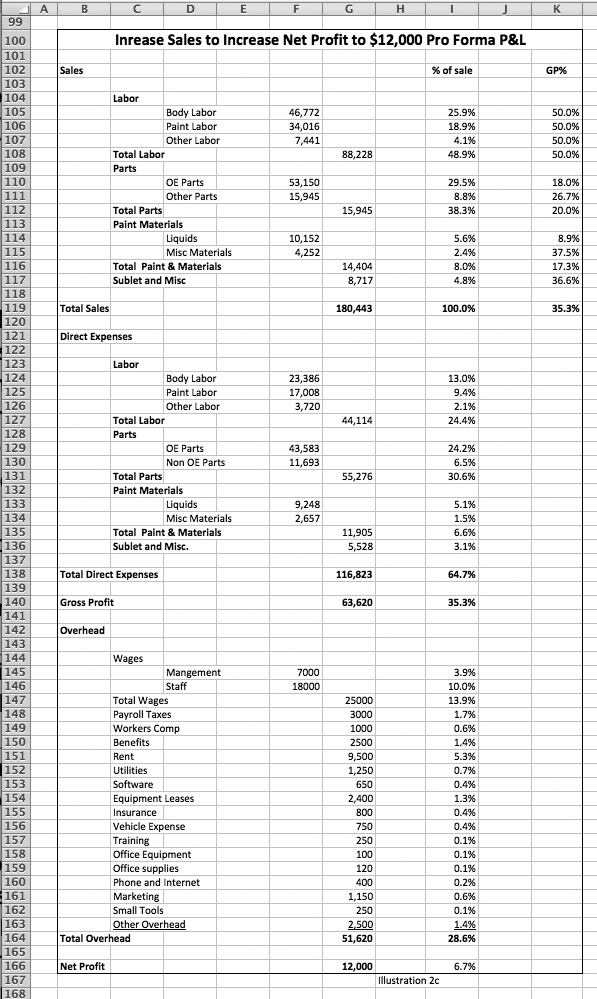
The budget to generate those additional hours is shown in the Body Labor Cost section of the P&Ls. The current P&L allows $22,000 to pay for the $44,000 in sales. In the Pro-Forma P&L, $23,386 is available to pay for the additional hours produced.
Those 925 hours can be assigned to individual technicians based on their current share of hours sold. Example: Brian, a metal tech, is currently producing 220 hours per month. That’s 25 percent of the total body hours produced. With the new production target of 925 body hours, Brian can reasonably be expected to generate 25 percent of the new target metal hours. Twenty-five percent of 925 hours equals 231.5 billed hours. Brian needs to generate 231.5 billed hours per month for the shop to achieve their goal of $12,000 in net profit. If there are 20 work days in the month, Brian would need to generate 11.57 hours per day.
The first step in achieving a goal is to share the goal with the team. Let each team member know their part in achieving the goal and provide a simple measurement tool to allow each team member a way to constantly measure their progress toward achieving the goal.
Bill can create a simple worksheet that Brian can use to track his daily billed hours against the goal of 11.57 hours per day. The same concepts and tools may be used in the paint department. Estimators should have a simple tool showing how their actual sales compare to the goal. Simply providing and monitoring these simple tools encourages team members to achieve their goals. For more on this concept, read Charles Coonradt’s “The Game of Work.”
The illustration presented by Sample Autobody is just a start on what may be achieved through a thorough understanding of the P&L and how it may be used as a tool. You can run simple pro-forma P&Ls to determine the impact of reducing costs, both direct and overhead. You can determine just how much your business can reasonably be expected to produce through the generation of Pro Forma P&Ls. Pro Forma P&Ls, in conjunction with Pro Forma Cash Flow Statements, form the basis of a solid business plan.
Get Started
Learn to use the P&L as a tool! Begin by calibrating the P&L, creating a tool that may be used for the generation of KPIs and will serve as the foundation of Pro Forma P&Ls that will assist in setting and achieving goals.
Share this series with your accountant or controller. Find seminars on financial management for collision repair facilities. Take Accounting 1A at a local community college! Work with your management system provider or with paint company consultants (business development managers) to refine and interpret KPIs. You will find that the P&L is the best tool you’ve ever paid for!
PS: This is my final article for BodyShop Business. Due to ongoing health issues, my wife and I have decided to retire. I owe a debt of gratitude to BodyShop Business, the readers and the entire collision repair industry. I had a great and rewarding career, and I thank all of you for that! Keep up the good work, and go sell something!
To catch up and read Part I, click here.